Information for advice professionals only.
It is important that investors understand the unique characteristics of private market assets, including differences in how risk and returns are calculated and reported.
One of the defining characteristics of traditional closed ended private market investments is the irregular timing of cash flows between investors and fund managers. Investors will typically give and receive capital at intervals and in varying amounts, with capital being requested by fund managers as needed to fund new investments, and money being returned to investors over time as those investments are exited. This means measuring returns and benchmarking across asset classes can be a challenging exercise for investors. As a result, the industry has adopted a number of different performance measures: internal rate of return (IRR), money multiples (TVPI, DPI, and RVPI), and public market equivalent (PME). Let’s explore each of these in more detail.
Internal rate of return (IRR)
The IRR is a measure of return on investment. Expressed as a percentage, the IRR is based upon the realised cash flows and the valuation of the remaining interest in the partnership. It is an estimated figure, given that it relies upon not only cash flows but also the valuation of unrealised assets. IRR can be expressed as gross or net of fees and carried interest – net IRRs tend to be the most commonly used metric.
The early years of a fund’s life are characterised by net cash outflows and negative returns, resulting from the loss of expenses incurred during the fund’s formation and the deployment of capital into portfolio companies or assets. Eventually, the fund will see cash inflows as it begins to generate a return on its investments. Once they have matured, the fund manager can begin to exit the companies or assets invested in, with capital being returned to investors.
An IRR calculation has the following pros and cons:
Pros:
Incorporates the time value of money in the calculation
Relatively easy to calculate, interpret, and compare
Cons:
Impractical implicit assumption of the reinvestment rate
Gaming/manipulation is possible, for example, early distributions can disproportionately boost IRR
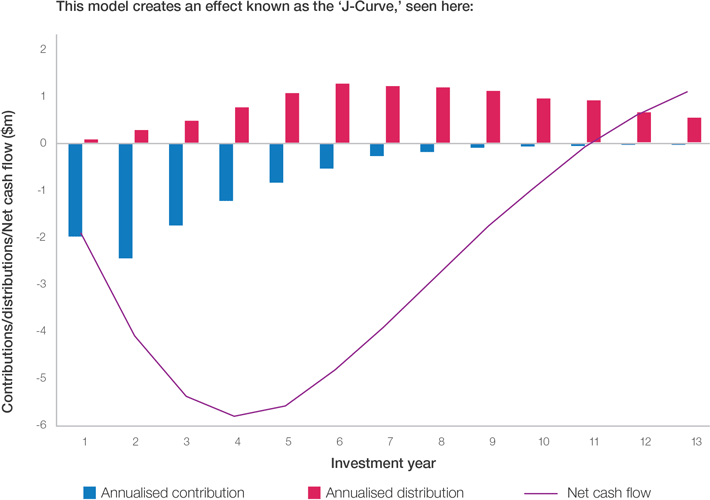
J-Curve effect
As most private market investments are not valued or traded frequently, it is a challenge for asset allocators to make sure they benefit from the higher expected returns, but also to keep their private market exposure within a certain range. It is therefore beneficial to monitor the cash flow pacing and value of existing investments to determine if an allocation is on target.
The ‘J-Curve’ effect is used to describe the way private equity funds’ net cashflows are often negative in the early years, before increasing and turning positive in later years. In the first few years of the fund, negative returns are typically experienced due to the associated fees of investment, management, and the portfolio's immaturity. The fund’s net cashflow begins to increase in the later years when investments begin to mature and are eventually realised, in the form of distributions.
Benchmark pacing models such as the J-Curve, using the internal rate of return, can help analyse the cash flows and value of a private market’s portfolio in relation to a diversified portfolio of assets. This in turn helps investors anticipate returns and better predict or manage cash flows.
Below are some ways the J-Curve is currently used by investors:
The model demonstrates the cashflow pacing behaviour of managers. For example, how much capital – and at what points do they call or distribute – over the lifetime of a fund.
It also helps potential LPs understand whether the cadence and size of a manager’s calls and distributions will be feasible in the context of their total portfolio’s cashflow schedule.
Drives greater efficiency when managing capital calls and re-investment decisions.
Use cases for J-Curve
Strategic allocation
Enhance confidence around allocation decisions by understanding how much and how quickly capital is typically called and returned for a strategy or a specific fund
Assess payback period, in addition to IRR, as an early indication of whether the investment met expectations as well as help inform future decision-making
Screening/due diligence – cash flow
Contextualise the manager’s cash flow behaviour earlier in the due diligence process to enable better conversations with prospective GPs
Evaluate whether the typical cadence and size of a fund manager’s calls and distributions are suitable in the context of the investor’s expected cash flow requirements
Compare similar managers in the context of their shared benchmark when making head-to-head allocation decisions
Portfolio monitoring/benchmarking analysis
Understand the time-series evolution/ historical returns for each benchmark in detail
Compare IRR side by side with cash flow timings to better interpret performance
Peer comparison
Track capital pacing trends against the manager’s peers to see where they stand against other GP’s returns throughout the fund’s lifecycle
Marketing – GPs can use J-Curve to illustrate previous curves versus competitor funds for marketing materials and pitches
Multiples
Multiples are another metric used to measure returns for private capital investments. Expressed as a multiple (e.g. 0.5x, 1.2x, 2.0x), they look at the proportion of capital invested vs. the amount returned to investors. There are three types of multiples typically reported by funds:
1. Distribution to paid-in ratio (DPI)
Also called realised return, DPI concentrates on distributions back to investors, comparing them to the sum of capital contributions made by investors. The calculation for DPI is as follows:
DPI = Capital Returned to Investors / Capital Called
2. Residual value to paid-in ratio (RVPI)
Otherwise referred to as unrealised return, RVPI focuses on the ratio of the residual value of assets owned by the fund (using current valuations) to capital paid in by investors. The equation for RVPI is:
RVPI = Net Asset Value (NAV) / Capital Called
3. Total value to paid-in ratio (TVPI)
Also called total return, TVPI is the sum of a fund’s distributions and residual value of assets, divided by paid-in capital.
TVPI takes into account the returns that would be achieved if unrealised assets were sold at current valuations and distributed back to investors, while also considering capital already returned to investors. TVPI therefore provides a more comprehensive view of returns against just DPI, although using current valuations for unrealised assets may not provide an accurate picture for future returns. TVPI is calculated as follows:
TVPI = RVPI + DPI
At the start of a fund’s life, TVPI and RVPI are both in deficit due to net cash outflows and negative returns, while DPI is zero since no capital has been distributed back to investors. In the early years, both TVPI and RVPI begin to grow as the fund manager starts to deploy capital into assets and the value of assets held by the fund increases. After year three, the fund manager may begin to exit some of the investments and RVPI begins to shrink as the residual value of assets held falls. By contrast, TVPI increases and DPI also starts to grow as money begins to be distributed back to investors. When DPI is equal to one, the fund has broken even, as money paid in is equal to money distributed; any number above this indicates that the fund has distributed more capital than has been paid in.
Public market equivalent (PME)
The final performance measure considered in this lesson is PME, which provides investors and fund managers with a method for benchmarking the returns of a private capital fund against the return of a chosen public market index.
Comparison to a public index allows both investors and fund managers to review the relative performance of their investments. For investors, this is an important exercise, helping to inform portfolio allocation decisions and to evaluate the performance of one asset class against another. For fund managers this can form a key aspect of fund marketing activities, helping to showcase fund outperformance and to secure capital commitments from investors.
The key obstacle here, however, is that private capital returns are not directly comparable with public market indices due to the illiquid nature and irregular timing of cash flows. The industry often uses the analogy of ‘comparing apples with oranges’ in relation to this difficulty. To address the issue and provide a more meaningful, like-for-like comparison with the market, PME was developed.
PME metrics benchmark the performance of a fund, or a group of funds, against an appropriate public market index while accounting for the timings of fund cash flows.
Information current as at June 2024. This content was produced by Preqin Ltd and adapted with permission by BT Financial Group. This document may contain material provided by third parties derived from sources believed to be accurate at its issue date. While such material is published with necessary permission, the Westpac Group and Preqin accept no responsibility for the accuracy or completeness of, nor does it endorse any such third party material. To the maximum extent permitted by law, we intend by this notice to exclude liability for this third party material. The content is based on the best data readily available at the time of creation, however the accuracy, completeness or timeliness of such data is not guaranteed. Content may include general financial information and examples; however, these are for illustrative purposes only, and may not be applicable to your personal circumstances or needs. The content does not constitute financial or investment advice and the content hereunder should not be considered as a substitute for professional advice. Any projections or forecasts presented may involve risk and uncertainty, and actual results may differ materially from those presented, projected or forecast. Past performance is not a reliable indicator of future performance. This communication has been prepared for use by financial planning professionals only. Except as permitted by the copyright law applicable to you, you may not reproduce or communicate any of the content on this website, including files downloadable from this website, without the permission of the copyright owner.