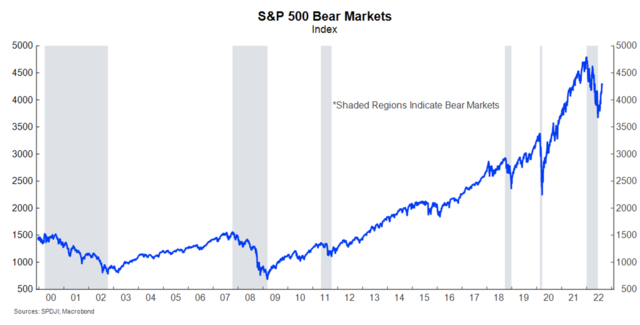
- A bear market is typically defined as a price fall of 20% or more from a recent peak. The US share market, as proxied by the S&P 500 index, entered a bear market at the start of June.
- The sharp fall in equity prices coincided with the worst first half performance of the S&P 500 index since 1970, spurred by an aggressive shift in monetary policy by major central banks.
- Investors are expecting the rapid policy tightening to push the US economy into recession. Growing concerns of a US recession, changes in risk-free interest rates and changes in inflation expectations have underpinned the recent falls in the S&P 500 index and an increase in the equity risk premium.
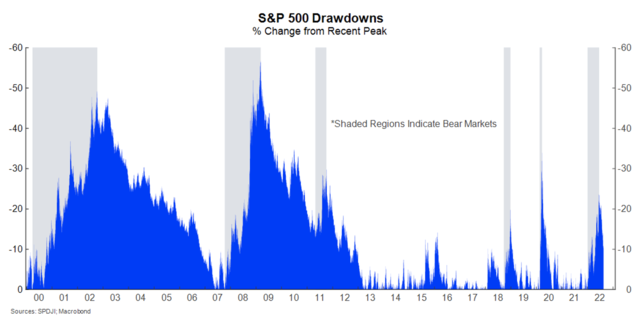
- Since 2000, the average US bear market has lasted 15 months, during which time the S&P 500 has declined by 33.8% on average. Additionally, it has taken an average of 34 months for equity losses to be recouped.
- A common feature of bear markets are price rallies before the market reaches a trough. Each bear market we have examined has experienced at least one rally of 5% or more before reaching a trough. The largest bear market rally rebounded over 24% before bottoming out.
- The S&P 500 has rallied 16.8% since its most recent low. However, there is considerable speculation around whether the current rebound is a change in direction for the market or just a bear market rally set to be unwound on the way to a new trough.
- Despite being highly correlated to the US, the Australian share market is yet to enter a bear market. However, we could not rule out a domestic bear market should global and domestic economic conditions deteriorate considerably.
Bear and Bull Market Definitions
The term ‘bear market’ is commonly used within financial markets to describe large price declines characterised by weak investor sentiment. Bear markets typically coincide with periods of economic recessions, tight monetary conditions or negative economic shocks. Such periods result in changes to investor expectations around expected returns and risk, and subsequently, asset prices. In contrast a ‘bull market’ describes a period of strong price growth associated with a rise in investor sentiment.
Unsurprisingly, bull and bear markets tend to mirror fluctuations in the business cycle. Furthermore, asset markets typically lead the economic cycle as investors price in the outlook for growth and inflation.
A bear market is typically characterised as a price fall of 20% or more from a recent peak. Conversely, a bull market is commonly defined as a 20% price rise from a recent trough. By this definition, the US share market, as proxied by the widely-watched S&P 500 index, entered a bear market at the start of June. The S&P 500 reached an all-time high on 3 January this year before beginning its descent lower. The index hit the -20% threshold on 13 June and hit a maximum drawdown (to date) of -23.6% on 16 June. Since then, the S&P 500 has partly recovered and is currently trading 10.7% below the all-time high level.
Share Market Performance in 2022
The sharp fall in equity prices since January’s peak coincided with the worst first half performance of the S&P 500 index since 1970 and the fourth worst start to a calendar year on record.
Declining equity valuations have been a global phenomenon over 2022. The declines have been spurred by an aggressive shift in policy by major central banks to fight inflation. At the start of 2022, many central banks held the view that elevated inflation would be largely ‘transitory’ and that supply-chain disruptions would unwind relatively swiftly. However, inflation has proved much more persistent than expected and temporary effects longer lasting. The war in Ukraine and China’s COVID-zero policy have also added fuel to the inflation fire. As a result, central banks are now aggressively removing monetary policy stimulus to combat rampant inflation.
Yield Curves and Bear Markets
In the US, market participants are expecting the Federal Reserve (Fed) to continue to aggressively hike interest rates for the rest of 2022 to tame inflation. As at 18 August, there is tightening of 120 basis points still priced in for 2022. Further, market pricing implies that market participants are expecting the rapid policy tightening to grind economic activity to a halt and potentially push the US economy into a recession. The US economy has already contracted for two consecutive quarters, as measured by Gross Domestic Product (GDP), but the National Bureau of Economic Research does not deem conditions to be that of a recession. Indeed, money-market securities are also suggesting Fed rate cuts will materialise as soon as early 2023.
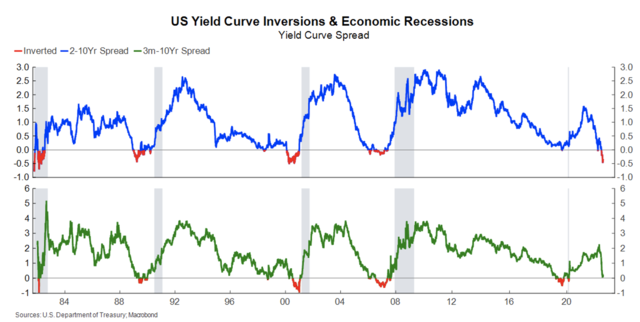
Attention has also turned to the US treasury yield curve, which has historically been a reliable leading indicator for future economic activity. An inversion of the yield curve is where a shorter maturity bond yield is higher than a longer maturity bond yield. An inversion of the 2-10-year part of the yield curve (i.e the 2‑year yield is higher than the 10-year yield) is typically interpreted as a potential recession indicator. This section of the US yield curve has been inverted since the start of July, reflecting the markets concerns of an impending US recession. Some analysts also closely eye the 3-month-10-year portion of the yield curve. This curve is not yet inverted, however, it has narrowed considerably over the past two months and appears set to invert shortly.
Growing concerns of a US recession, changes in risk-free interest rates, and changes in inflation expectations have underpinned the recent falls in the S&P 500 index and an increase in the equity risk premium. Additionally, companies that had seen a huge run up in equity valuations over 2021 (e.g. high growth technology companies) have recorded large price declines amid an environment of higher interest rates and higher risk premiums. Such companies make up a larger share of the US stock market than in many other countries.
Learnings from Past Bear Market Cycles
Since the turn of the century, the S&P 500 has experienced four bear market episodes, including over the start of 2022. There have also been two occurrences where drawdowns have reached over 19%, but have fallen short of the 20% threshold commonly associated with a bear market. The arbitrary nature of the bear market definition means it is worth also considering these occurrences when reflecting on recent bear market events.
Since 2000, the average US bear market has lasted for 15 months, during which the S&P 500 has declined by 33.8%, on average. When excluding the two market drawdowns below 20%, this rises to an average fall of 40.9% over a period of almost 20 months. Therefore, by historical standards, the current bear market episode may have further to run, having declined by 23.6% over seven months.
However, the bear market events examined are not all equal and can be broadly split into two distinct groups.
Firstly, bear markets associated with major economic shocks, including the bursting of the dot-com bubble, the Global Financial Crisis (GFC) and most recently, the COVID-19 pandemic. These events are marked by more significant equity drawdowns, and in the case of the dot-com bubble and the GFC, have been relatively more prolonged. They have also coincided with US economic recessions.
| Bear Market | Peak | Trough | Length (months) | Drawdown (%) | Months to recover |
|---|---|---|---|---|---|
| 1 | 24 March 2000 | 9 October 2002 | 44 | -49.1 | 81 |
| 2 | 9 October 2007 | 9 March 2009 | 25 | -56.8 | 70 |
| 3 | 29 April 2011 | 3 October 2011 | 7 | -19.4 | 7 |
| 4 | 20 September 2018 | 24 December 2018 | 5 | -19.8 | 6 |
| 5 | 19 February 2020 | 23 March 2020 | 2 | -33.9 | 7 |
| 6 | 3 January 2022 | 16 June 2022 | 8 | -23.6 | |
| Average | 15 | -33.8 | 34 | ||
| Declines >20% | 20 | -40.9 | 53 | ||
| Declines <20% | 6 | -19.6 | 6 |
This compares to the bear markets of 2011 and 2018, which were relatively shorter and less severe. These events were not linked to a major economic shock or recession. The market sell-off in 2011 was spurred by weakening economic activity and recession concerns, alongside a broadening European debt crisis. At the time, the US also received a credit downgrade from Standard & Poor’s after reaching its debt ceiling. In contrast, the downturn in 2018 was linked to US President Trump’s trade war with China, which sapped investor sentiment. A rate-hiking cycle was also underway in 2018 from the Fed.
The resulting question is which of the two categories will this year’s bear market episode fall into? This is a difficult question to answer. Much will depend on the path of inflation and interest rates and, crucially, how the US economy reacts to tightening financial conditions.
On one hand, this market episode may more closely mirror the bear markets of 2011 and 2018 where investor sentiment was weakened by an aggressive Fed and recession fears. Alternatively, it may be the case that a recession scenario eventuates and equity markets move into a more prolonged and severe bear market.
Timing of a Recovery in Equity Markets?
Naturally, our minds next turn to how long it may take for equity prices to recover. Over the previous bear markets examined it has taken an average of 34 months for equity losses to be recouped.
However, the amount of time taken is materially different for the two types of bear markets we have considered. More severe bear markets have taken an average of 53 months to recover, compared to an average of just 6 months for the 2011 and 2018 bear markets.
The characteristics of this year’s bear market may, therefore, have a material impact on the market recovery, although the rapid equity rebound from the COVID-19 shock proves that in markets anything is possible.
Additionally, a common feature of a bear market is a price rally before the market reaches its trough. This is referred to as a bear market rally and can make it difficult to call whether the market has truly bottomed out. Each bear market we have examined has experienced at least one rally of 5% or more before reaching a trough. The largest bear market rally rebounded over 24% before bottoming out.
The S&P 500 has rallied 16.8% since its most recent low as investors have pared back their expectations of how aggressively the Fed will raise rates to curb inflation. However, there is considerable speculation around whether the current rebound is a change in direction for the market or just a bear market rally which will be unwound on the way to a new trough. This again will very much depend on the path of inflation and interest rates and how the US economy reacts to tightening financial conditions.
Australian Comparison
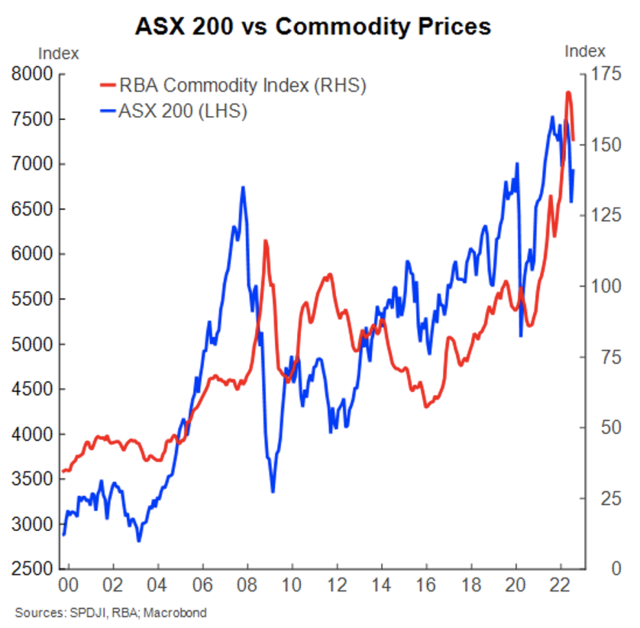
The Australian market tends to be highly correlated to the US, especially in its reaction to global macroeconomic factors, which have been a key driver of equity markets over the start of 2022. However, the Australian share market, as measured by the ASX 200 index, has outperformed the US in 2022. This is predominantly due to the construction of the relevant market indices. The Australian market has a heavy weighting towards energy and resources companies, which have experienced considerable tailwinds from high commodity prices due to strong global demand and the war in Ukraine. The Australian share market index also has less of a weighting towards technology-related growth stocks, which have been harder hit in US equity markets.

On 18 August, the ASX 200 closed 6.8% below its peak in August last year, after being as much as 15.7% lower in mid-June. Accordingly, the Australian share market is yet to enter a bear market.
Aside from the ASX’s resources related outperformance, market activity currently does not reflect expectations of a looming recession. For example, no portion of the Australian yield curve is currently inverted. A smaller expectation of a recession in Australia may also help explain why Australian share markets have outperformed the US and have not entered a bear market. However, the trajectory of US share markets will be a critical factor for the outlook of Australian (and global) share markets, and we could not rule out a domestic bear market should global and domestic economic conditions deteriorate considerably. A material slow down in global growth, for example, would likely be a headwind for commodity prices and by extension, local equities.
This document has been created by Westpac Financial Services Limited (ABN 20 000 241 127, AFSL 233716). It provides an overview or summary only and it should not be considered a comprehensive statement on any matter or relied upon as such. This information has been prepared without taking account of your objectives, financial situation or needs. Because of this, you should, before acting on this information, consider its appropriateness, having regard to your objectives, financial situation and needs. Projections given above are predicative in character. Whilst every effort has been taken to ensure that the assumptions on which the projections are based are reasonable, the projections may be based on incorrect assumptions or may not consider known or unknown risks and uncertainties. The results ultimately achieved may differ materially from these projections. This document may contain material provided by third parties derived from sources believed to be accurate at its issue date. While such material is published with necessary permission, Westpac Financial Services Limited does not accept any responsibility for the accuracy or completeness of or endorses any such material. Except where contrary to law, Westpac Financial Services Limited intends by this notice to exclude liability for this material. Information current as at 10 December 2021. © Westpac Financial Services Limited 2021.