If you have ordered anything online recently, you can probably attest to the impact of supply-chain disruptions. Delays in deliveries have become standard, alongside skyrocketing shipping costs for importers and exporters. The lengthy delays mean some businesses are facing material shortages.
So, what exactly is underpinning the bottlenecks?
Well, as much as I like a succinct answer, there isn’t just one cause.
Much of the problem stems from COVID-19-related developments. Transport bottlenecks emerged last year because of a sharp increase in global demand for goods. Due to lockdowns, the demand for goods jumped sharply while services consumption plummeted. But at the same time, factories were hit with constraints on their operations.
As 2020 wore on, a global shortage of shipping containers emerged, as well as a mismatch in the location of containers, which were often full in one direction and empty in the other. This shortage was exacerbated by congestion at some ports.
On top of that, global supply chains have also been hit by diplomatic tensions, power shortages in China and extreme weather. Oh, and the Suez Canal was also blocked for six days in March this year.
All that is to say, the bottlenecks in supply chains are a complex, multifaceted problem and they are unlikely to be resolved in the short term.
Wide-reaching ripples
The disruptions have snowballed over the past year. Purchasing managers’ index surveys, conducted by Markit in 44 countries, provide one measure of bottlenecks. Through 2021, the survey suggests supplier delivery times have consistently deteriorated across the globe.
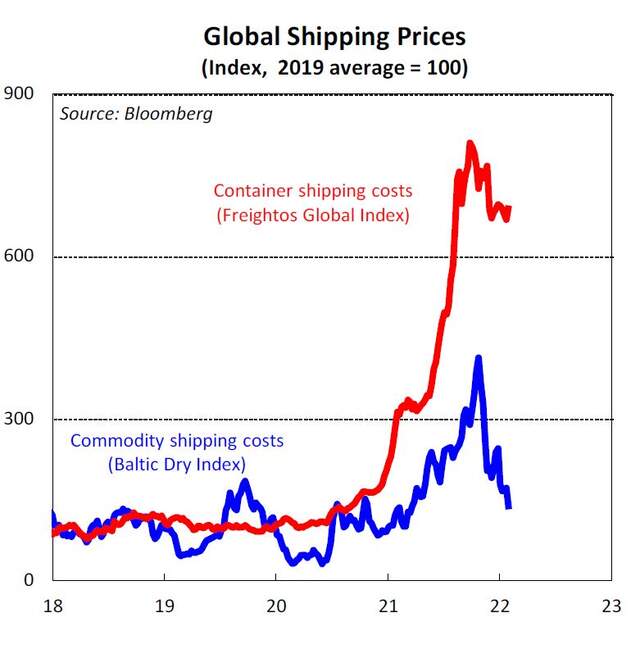
Meanwhile, container shipping costs have surged over 600% since the start of 2020, according to the Freightos Baltic Index – a benchmark metric based on freight rates in 12 important maritime lanes. Costs have moderated somewhat in recent months. Encouragingly, the Baltic Dry index – a proxy for dry bulk shipping costs – has fallen more significantly.
An April 2021 survey conducted by the Australian Bureau of Statistics found around 30% of Australian businesses had been impacted by supply-chain problems. However, given these issues have continued to persist throughout the year, this figure is likely higher now.
In light of the developments over the past two years, many businesses have reassessed the resilience of their supply chains, pushing some businesses to diversify their supply network to avoid dependency on a particular country.
Importantly for Australian manufacturers, there is a push to scale up domestic production capabilities for critical products. The government has noted medicine, personal protective equipment and fertilisers as points of focus.
Another consequence of supply disruptions is that energy-related commodity prices have increased significantly since the middle of the year. Energy prices have been boosted by strong demand for goods alongside the global economic recovery.
Relief is coming… eventually
The immediate question is, how much longer will these disruptions persist?
Unfortunately, it will take some time for these bottlenecks to be worked out. Our customer liaison suggests that disruptions will persist in some form over 2022.
On the upside, the move to relax COVID-19 restrictions around the world (notwithstanding recent setbacks in some countries) will see a rebalancing in consumption back towards services and away from goods. The Reserve Bank (RBA) Governor Lowe has stated he expects this shift may help disruptions begin to ease. However, Lowe made these remarks before the emergence of Omicron. Omicron could prolong the supply-chain disruptions for longer.
Inflationary pressures are swelling
The disruptions to supply chains, alongside strong goods demand and rising energy prices, have pushed producer price inflation to its highest level in many years in a number of economies. However, the extent to which this has been passed onto consumers varies.
In the US annual producer price inflation surged to 12.2% in the year to December 2021. Personal consumption expenditure (the Federal Reserve’s target measure of consumer prices) hit 5.8% in December, the fastest rate since the early 1980s.
In Australia, the disruptions have contributed to large price increases for some consumer durable items, including cars and some household goods. These developments, alongside the lift in energy prices, and pushed up annual headline consumer price inflation (CPI) to 3.5% in the December quarter. But overall, producer price inflation remains much lower than some other parts of the world, touching 3.7% in the December quarter. If producer prices lift more than consumer prices, this may squeeze the profit margins of some businesses, as it suggests rising costs have not been entirely passed onto consumers.
Trimmed mean CPI, a measure of underlying price pressures and the Reserve Bank’s preferred measure of inflation, has also picked up. In fact, it hit 2.6% in the December quarter – the highest rate in more than seven years, and notably above the mid-point of the central bank’s 2–3 per cent target band.
Pandemic curveballs
The emergence of the Omicron variant poses a fresh hurdle for the economy although we expect it will only temporarily pause the recovery. Surging case numbers have underpinned a ‘shadow lockdown’. Millions of Australians have been forced to isolate after contracting the virus or being identified as close contacts. Many others have been more cautious about leaving home. Subsequently, absenteeism has strained many businesses.
The fresh disruptions also may delay when supply bottlenecks are resolved.
We expect activity will pick up as case numbers decline, and as such the recovery is likely to resume through February or March. In fact, we still expect 5.5% GDP growth in 2022 – that represents strong growth at more than twice the long-run average. However, the pandemic remains a key downside risk, with the possibility of another wave of infections, particularly as we head into the winter months.
Central banks are watching closely
Central banks, up until relatively recently, were at pains to frame inflationary pressures as transitory. The longer supply disruptions persist, the bigger the likelihood that these ‘temporary’ price increases will become entrenched. The risk for central banks is the increase in inflation is faster and more persistent than they have forecast.
Indeed, inflation and employment have picked up considerably faster than the RBA expected. Accordingly, it dropped its bond-buying program in February, and sharply revised up its inflation forecast and moved its unemployment forecasts lower to sub 4 per cent. These shifts lay the groundwork for rate hikes later this year.
Governor Lowe has conceded it is ‘plausible’ that the cash rate could lift ‘later this year’, marking a significant shift in guidance. Not long ago, the RBA was maintaining that its ‘central scenario’ was that the cash rate would not increase before 2024. However, the RBA has continued to emphasise it is prepared to be “patient”, highlighting the need to observe more wage and inflation prints before determining that inflation is “sustainably” in the target band.
We expect the RBA will kick off the hiking cycle by lifting the cash rate by 15 basis points in August. At that point, there will have been two more wage prints and two more inflation prints, which we expect will be enough evidence to satisfy the RBA. Although, we wouldn’t rule out the possibility of lift-off as early as June.
And what does this all mean for the Australian equity market? On one hand, higher interest rates are typically perceived as a headwind for equity markets, as it becomes more expensive to borrow, and companies and consumers curb their spending. But on the other, we are at the start of an upswing in global economic growth as restrictions lift, notwithstanding any setbacks from new variants such as Omicron, which will support equity prices. Given these competing forces, and the enduring uncertainties over the pandemic, volatility in equity markets seems likely.
BT Economics
Superannuation income streams types
Calculating the rate of income support payments
This document has been created by Westpac Financial Services Limited (ABN 20 000 241 127, AFSL 233716). It provides an overview or summary only and it should not be considered a comprehensive statement on any matter or relied upon as such. This information has been prepared without taking account of your objectives, financial situation or needs. Because of this, you should, before acting on this information, consider its appropriateness, having regard to your objectives, financial situation and needs. Projections given above are predicative in character. Whilst every effort has been taken to ensure that the assumptions on which the projections are based are reasonable, the projections may be based on incorrect assumptions or may not consider known or unknown risks and uncertainties. The results ultimately achieved may differ materially from these projections. This document may contain material provided by third parties derived from sources believed to be accurate at its issue date. While such material is published with necessary permission, Westpac Financial Services Limited does not accept any responsibility for the accuracy or completeness of or endorses any such material. Except where contrary to law, Westpac Financial Services Limited intends by this notice to exclude liability for this material. Information current as at 10 December 2021. © Westpac Financial Services Limited 2021.