Private Credit continues to deliver consistent absolute returns, offering a yield advantage compared to other traditional bond and credit sectors, all whilst helping investors diversify their public market exposure in a rising rate environment.
Growing acceptance of Private Debt as a mainstream asset class
Middle market companies are a key part of America’s economy, making up one third of the US private sector GDP. Since the global financial crisis (GFC), new regulations and capital requirements have led to banks pulling away from certain lending activities. Alternative credit providers have since filled the gap providing capital directly to these middle market borrowers in need of funding. This is changing the way investors think about their fixed income allocations, blurring the line between opportunistic and core fixed income investments.
Private debt as an asset class has grown over the past decade driven by low interest rates and high demand for yield. On the supply side, issuers continue to look to the private markets due to its greater flexibility, speed and certainty of execution. On the demand side, investors covet assets that can hedge inflation, protect capital whilst still offering a decent yield. With government bond yields at historic lows and as the global search for yield continues, investors are increasingly looking for opportunities that can meet their return objectives over the longer term. Private credit (or commonly also known as the private debt / middle market lending), is one of the few remaining sectors that can offer relatively high yields over public bonds and traded credit. Chart 1 below highlights the considerable yield advantage private debt still offers over other markets.
Annualised estimates from Preqin in October 2021 put private debt assets under management (AUM) globally near US$1.21tn. This is off the back of a decade of growth which prior to the GFC, was only estimated to be around US$80bn in size. As investors have become more willing to accept illiquidity in exchange for incremental return, and as modern technology and reporting processes greatly improve the accessibility of these assets to the traditional investor base. It is likely that investors will continue to embrace, and in some cases, increase their allocations to private debt as a core part of their fixed income allocation.
Increased competition but at what cost?
Among the strategies pursued by private debt funds, large or otherwise, core direct lending and distressed debt made up the bulk of the capital raising in 2020 and 2021. Distressed opportunities recorded sizeable dollar inflows in the second half of 2020, whilst direct lending funds rose a record $80.7 billion the following year as distressed funds receded following a record raise the year prior. In Europe, deal activity stabilised in 2021 and whilst private debt in Europe is estimated to be 5 to 10 years behind the US, the region is rapidly maturing.
The growth of the private debt market is certainly a welcome development, however, one of the few concerns that is nascent among investors around the growth of the private debt market is the increased competition and its implications for the asset class.
These include:
- the consequential effect on asset valuations (i.e. pricing)
- the subsequent deterioration in lender protections with the emergence of “covenant-lite” deals in new issuance structures.
The consensus view is that if market conditions remain robust, the middle market environment will continue to be competitive, which has been evident in pricing as lenders bid for the most attractive deals. Using Unitranche[1] spreads as a guide, preliminary data shows average blended spreads of 568bps in the 4th quarter of 2021,marking the fifth consecutive quarter of declining spreads amid a competitive market environment. To put this into perspective, unitranche spreads have tightened 100bps since 2020.
Positively though, the illiquidity premiums available from the asset class remain robust as can be seen from Chart 3 below. While these concerns may temper some investors to consider an allocation to private debt, it is unlikely to deter investors all together.
One other key development is that well established lenders are starting to raise new capital with larger fund sizes. Consequently, some of these lenders have shifted up the market spectrum and now participate in billon dollar ‘mega’ deals. The growth of in-house origination capabilities and competition for deals from private equity sponsors has perhaps resulted in the large end of the private debt market edging into the realm of investment banking syndicate desks.
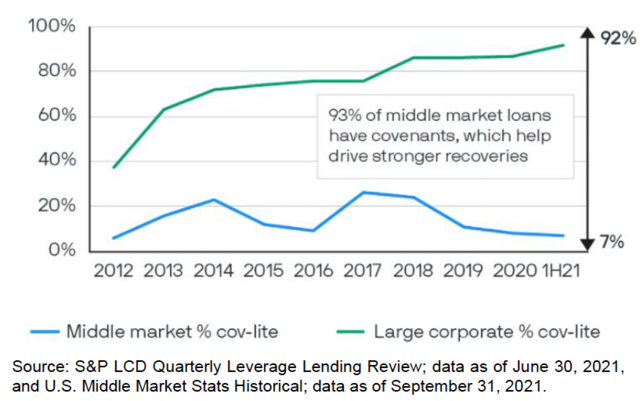
Evidence suggests that credit spreads and terms in this segment of the private debt market have converged with that of the traded public market. This has also led to some pressure from borrowers to remove covenants from deals, with some lenders giving into the pressure. Despite this recent dynamic, over 90% of private loans still maintain at least one covenant.
Conclusion
Private debt loans are less liquid than public fixed income and hence carry a significant yield premium. Whilst there is some evidence to suggest that spreads in this sector have compressed in lieu of a more competitive market, the illiquidity premium offered in the middle market continues to be robust, in BT’s view, meaning investors remain well compensated for this risk.
Middle market private loans also have structural advantages over traditional high yield and syndicated loans. They feature strong loan collateral and reasonable leverage and are typically originated directly. This means lenders can negotiate loan protections and deal terms tailored to borrowers specific needs. This is in contrast to the publicly syndicated loan market which has seen record covenant lite issuance.. The underlying managers appointed in the BT Private Debt program have differentiated sourcing and access to deep networks, as well as adhering to stringent and disciplined underwriting standards. As a result, the BT Private Debt portfolio is likely to focus on deals that allow for more flexibility, stronger structural protection and better financial covenants.
Putting aside manager selection, the characteristics described above are typically more prevalent in private debt offers when compared to public market debt. As such, private debt investments are more likely to have a favourable downside profile. Based on historical evidence to date, private debt generally has lower cumulative default rates and higher average recovery rates, which in turn drives consistently lower loss rates than the public markets
From a portfolio construction perspective, the BT Investment Team believe private debt markets will also continue to provide strong diversification benefits. Private mid-market loans aren’t highly correlated to traditional equity and bond markets and typically trade with much lower volatility. Looking ahead to 2022, bond yields are expected to trade with elevated levels of volatility. Rates have become a significant source of risk in fixed income as they seem primed for a sell-off. With inflation concerns being front of mind at present, private loans help mitigate duration risk. In fact, mid-market loans are primarily floating rate in nature and therefore create a natural hedge against rising rates.
Our expectations are for conservative 1st lien private debt to return between 6 to 8% p.a. (unlevered) over the coming years and more junior mezzanine pieces to potentially offer between 9 to 11% p.a. All in all, private credit continues to deliver consistent absolute returns, offering a yield advantage compared to other traditional bond and credit sectors, all whilst helping investors diversify their public market exposure in a rising rate environment.
1 Unitranche are a blended capital structure made up a senior and a junior debt security.
Chart 1: Yields across different sectors
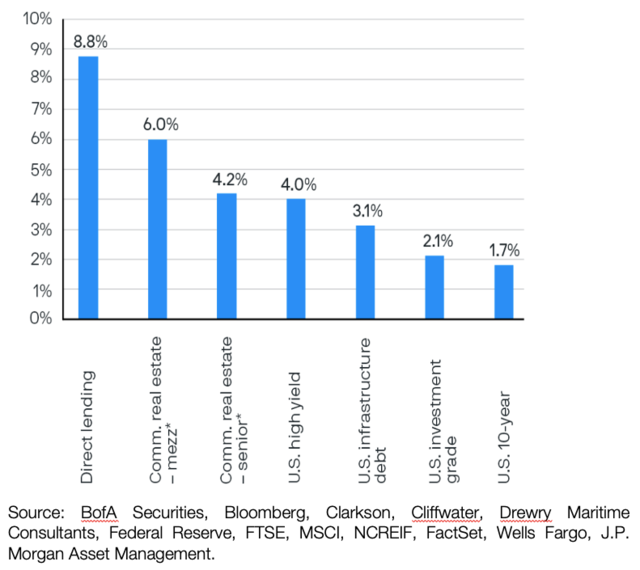
Chart 2: Annual Unitranche Spreads
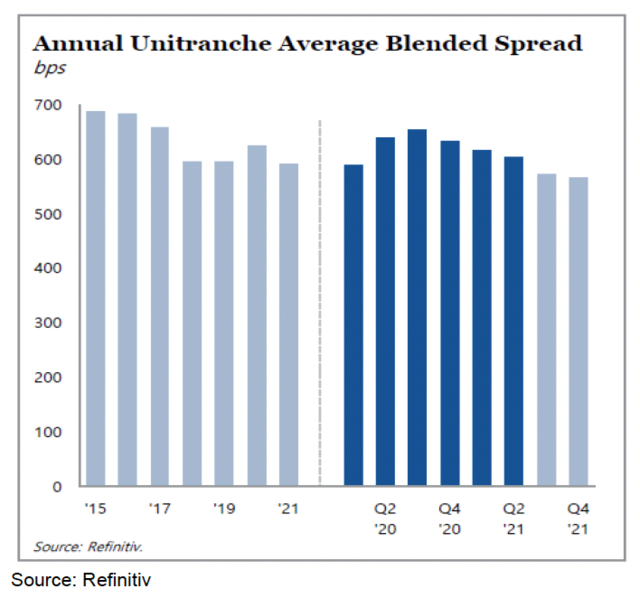
Chart 3: Illiquidity premiums
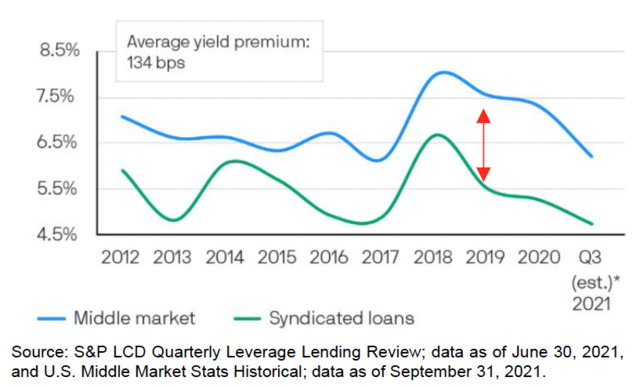
Chart 4: % Covenant (Cov) Lite Deals
Superannuation income streams types
Calculating the rate of income support payments
This document has been created by Westpac Financial Services Limited (ABN 20 000 241 127, AFSL 233716). It provides an overview or summary only and it should not be considered a comprehensive statement on any matter or relied upon as such. This information has been prepared without taking account of your objectives, financial situation or needs. Because of this, you should, before acting on this information, consider its appropriateness, having regard to your objectives, financial situation and needs. Projections given above are predicative in character. Whilst every effort has been taken to ensure that the assumptions on which the projections are based are reasonable, the projections may be based on incorrect assumptions or may not consider known or unknown risks and uncertainties. The results ultimately achieved may differ materially from these projections. This document may contain material provided by third parties derived from sources believed to be accurate at its issue date. While such material is published with necessary permission, Westpac Financial Services Limited does not accept any responsibility for the accuracy or completeness of or endorses any such material. Except where contrary to law, Westpac Financial Services Limited intends by this notice to exclude liability for this material. Information current as at 10 December 2021. © Westpac Financial Services Limited 2021.